What do you think about the following code?
int totalRecords = FileManager.GetTotalRecords();

List<Context> allContext = new List<Context>();

for(int i = 0; i< totalRecords; i++ )

{

    // Create a related object for each class..

    allContext.Add(new Context(i));


}
Is there any problem with the above code?
This is a fine piece of code. It will work fine when you run it with actual data. I have written a very similar code and I was very proud of that for 2 years. One day, in the production environment the code was running more than 4 hours and suddenly the system throws an out of memory exception and the application was crashed losing all user data. First I was in denial. I blame other application running in the background. I blame OS and in my hear I even blame the weather.
Out of memory exception was only possible when there is some kind of memory leak. You create some variable in memory and leave it there. If you do it repeatedly and do not clean up the resources of memory then your memory will be filled up and your application will be crashed.
But this problem was limited to C/C++. When there is no run-time environment like Java runtime or Dot Net CLR. In old days there was no automatic garbage collection. So programmers have to do this job by themselves. But if you are writing programs in Java or C# there is no need for managing the destruction of objects. It will be done for you by the automatic garbage collector.
So, why there was a problem with my code? and why it took me years to face this problem? The solution is easy and I will come back to it later. If you are programming for a couple of years then you know that once you know what the problem is then fixing the problem is relatively easy.

As a junior developer, I didn’t fully understand the garbage collection process. I was having the cursory knowledge of memory management and this partial information lead to a dangerous error in my code. Also, I was not adept to look for system resources when writing code. This was the reason that my application failed in the production.
Now, this article is aimed at beginning professionals who have started to write large projects. This aim is to give you some tools and ideas that you can use to look for the impact your code is making on system resources. The two most important resources are memory and processor.
Mindset No.1 Pay Attention to Your Memory
Let’s talk about an important resource that your code should take care and that is called the memory. Yes, that sweet memory sticks that you have bought on eBay or Amazon.
There are several reasons for doing so. First of all, nobody knows how your app is going to be used. How many hours it will run and how much data it will process. Therefore it is necessary that you should know the amount of memory your program is using once it started running. If it is running for a long time and there is a leak then it is possible that your application will crash and you lose data that is being in the memory of your computer.
In addition to that, if your application is taking too much memory then it will put the strain on other apps that are running alongside with your app. For example, right now chrome on my PC is consuming a whopping 7GB of RAM leaving less space for other apps.
If you don’t put a close attention to memory resources you will know that your app is tied to a specific hardware. It means that your application will behave differently with different hardware. For example, one of your deployment PC has 4GB of Ram and another PC has 2GB of RAM. If your application has memory leak then in PC with 2GB RAM your application will crash sooner and you will think that problem is with the hardware and not the software.
Hence following are three guidelines that I use before shipping my code to production:
- Calculate the minimum memory requirement
- Outline the hotspot or areas where there potential memory leak hotspots
- Load test and use tools to determine if there is any memory leak
Challenges when Calculating Memory Requirements
If there is an intermediate peak or surge of memory resources
When calculating the amount of memory your app needs you should take into consideration the piece of code that is creating resources. Look for lots of new keywords or new keyword within a loop as shown in the code at the start of this article.
If there is a suspicious piece of code that you think can produce a huge amount of memory in terms of unknown variables then protect it with a try and catch block and catch the out of memory exception. Following is the code listing:
try
{

     for (int i = 0; i < 200; i++)
     {
         // new keyword under the loop
         aChunkOfData = new byte[104857600];
         dataBytes.Add(aChunkOfData);
     }

}

catch (System.OutOfMemoryException excep)

{

  Console.WriteLine("Out of Memory Exception Occurs.. Now preventing the resourcess");

}
This will help your application from getting crash and losing all user data. In this way, you can notify the user that there are not sufficient resources to run the operation. In this way, you can make sure that your application is hardened against out of memory exception.
32-bit vs 64-bit System
Your app is allowed a certain amount of memory that it can access and it is called the virtual memory. Your app cannot directly access the physical memory but it can only access virtual memory address. This address is translated into physical memory by your CPU.
32-bit system provides less amount of virtual memory(2GB) that is available to each process whereas 64-bit can give more memory(128TB under windows 10). Your virtual memory can consist of your physical memory that is RAM and some amount of hard-disk memory. Your O.S can swap data from hard-disk to RAM and vice versa.
It does not mean you can create an app that can handle 1-TB of data if you have 4-TB hard disk drive. To improve performance the maximum amount of disk that your O.S can use is dependent upon the amount of physical memory that you have. Therefore your app is still dependent upon the physical memory(RAM) that your system has even if it is a 64-bit system.
Tools that you can use for catching up with memory leaks
The problem that I mention at the start is a challenging problem for me. Because I have been told that .Net client language runtime can take care of unused resources and that there will be no memory leaks possible in .net. So even if I am creating some resources and not using them then the run-time should come into action and throw out those extra chunks of bytes.
This is only true when the runtime is sure that you will not use those resources in the future then it will collect those wandering resources for garbage collection. For example, consider the following code:
public class Program
{
static void Main(String[] args)
{
    byte[] globalData = new byte[1000];
   // call the function
    DoTheWork();
    for(int i=0; i<globalData.length;i++)
    {
        byte aByte =(byte) (globalData[i]+1);
        SendData(aByte);
    }
}
public static void DoTheWork()
{
    byte[] data  = new byte[100];
    // work on data..
    for(int i =0; i<data.length;i++)
    {
        byte aByte =(byte) (data[i]+1);
        SendData(aByte);
    }
}
}
In this code, the byte array in the function DoTheWork() will be the target of garbage collector as this data array will not use after the function call. Therefore this will be collected by the garbage collector.
On the other hand, the global data array will remain in the memory until the program exited. This is because it is available throughout the lifecycle of the app. The code can use it at any time. Therefore garbage collector cannot remove it. Hence we can say that garbage collector looks for the scope. If it is within the scope then garbage collector has no power over it.
Now if you keep growing that global data array(if it is was a List array) and it become so large that system cannot allocate memory for that then your system will throw an out of memory exception. This is how a memory leak can be created in a .net application and this is what happens with my code that blew up during a prolonged operation. There was a slow memory leak and it came after 4 hours of continuous operation.
There is one basic tool that I use to catch that memory leak problem under windows platform and it is called performance monitor. Don’t try to use the task manager as I myself tried to use the task manager initially. Task manager is not designed for dealing with memory leaks.
How to use performance monitor:
- Goto run and type perfmon and press ok. This will open the performance monitor.
- Add the performance counter(Ctrl+n)
- Select Process and then select the ‘private bytes’ counter
- Select the app from the ‘instance window’ and then press ok. This will add the performance counter on the graph.
- Double click the graph and set the properties such as color. Also, set the minimum and maximum because the defaults are 0 and 100. Set a maximum value and set a scale so that you can view full amount of memory your system contains(e.g 8GB)
Following is the code that I have added to demonstrate the performance monitor in action. This code will populate the memory with huge chunks of bytes and create an artificial memory leak for demonstration purpose:
 List<byte[]> dataBytes = new List<byte[]>();

 byte[] aChunkOfData = new byte[104857600]; //100MB

Thread.Sleep(5000);

     for (int i = 0; i < 20; i++)
     {
        // Create Memory Resources
         aChunkOfData = new byte[104857600];

         dataBytes.Add(aChunkOfData);

     }

 // 5 seconds delay to show up on the graph
 Thread.Sleep(5000);

 for (int i = 0; i < 20; i++)

 {

     aChunkOfData = new byte[104857600];


     dataBytes.Add(aChunkOfData);
 }

 Thread.Sleep(5000);
 for (int i = 0; i < 40; i++)
 {
     aChunkOfData = new byte[104857600];

     dataBytes.Add(aChunkOfData);
 }
Following is the graph that I get from the above code:
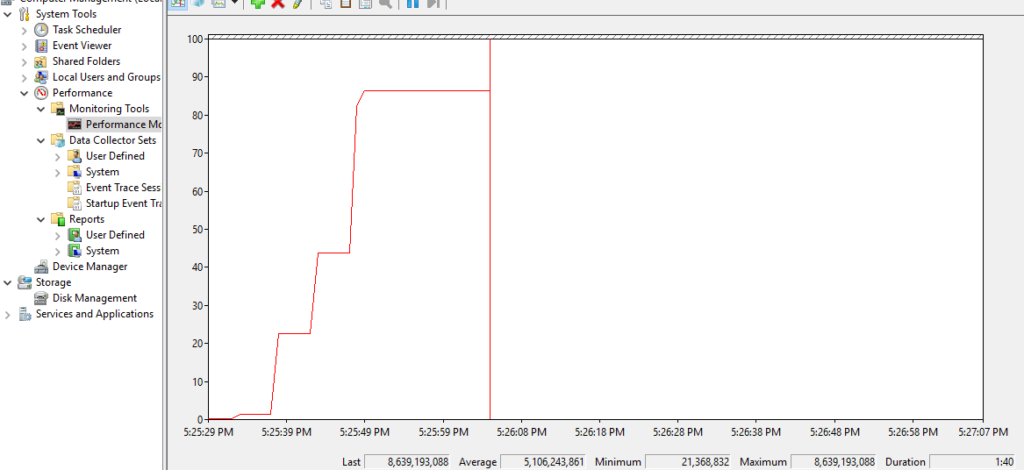
Private bytes counter represent the closest amount of memory that your application uses. As you can see the application is creating huge chunks of data bytes after 5 seconds interval and this is visible in the private bytes performance counter.
If you test your application and if there is a memory leak then you will see a slow upward graph throughout the running time of your application.
Mindset No.2 Pay Attention to Your Processor
Once there was the high priority requirement from customers. The requirement on the face looks simple. It was like adding 2+2. You know there are several programming requirements that look simple at the start but as you progress the complexity of the problem become clear.
The requirement was “to acquire serial data”. I just have to read data from a serial device using the driver of the device. It was a simple task. For the sake of demonstration let’s assume that the device is TCP/IP port. Following is the very similar code that I have written to acquire data from the serial device.
 bool UserExited = false;
int chunkSize=1024;
IPAddress ipAddress = new System.Net.IPAddress(new byte[]{127,0,0,1});
int portAddress = 1060;

TcpClient client = new TcpClient(new IPEndPoint(ipAddress,portAddress));
client.Connect(new IPEndPoint(ipAddress, portAddress));
NetworkStream stream=  client.GetStream();
while (!UserExited)
{
if(client.Available>0)
{
byte[] buffer = new byte[chunkSize];
stream.Read(buffer,0,chunkSize);

// transmit buffer..
stream.Close();
Can you guess the problem with the code!
Again this code was working fine. It does not miss any data can acquire huge chunks of data without any problem. But one day there was an additional requirement to acquire data from 3 serial channels and the system on which the code was running became a mess. It became completely unresponsive after some time.
Reason for that is simple. I use the polling method for data acquisition and that exploit or I should say abuse the most precious system resource —The Processor. Following is the snapshot for the task manager when the above code was running. This is a single thread acquiring data from the single port.
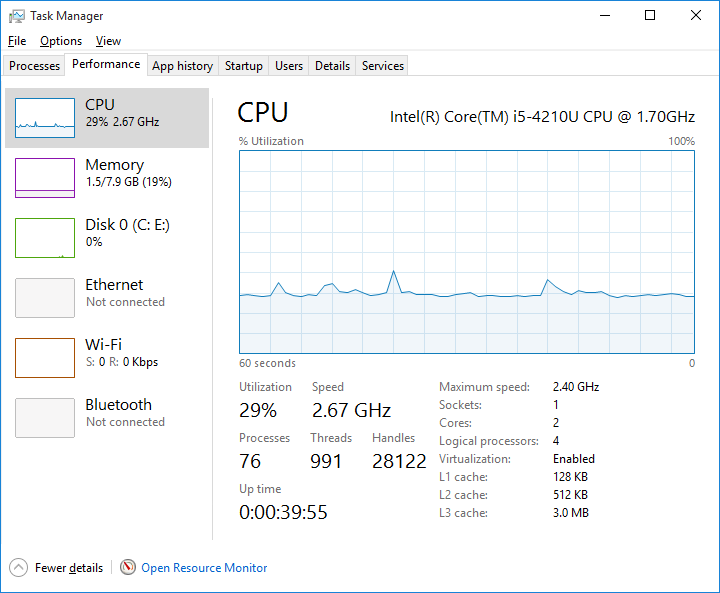
It is an intel core i5 processor which it has 4 core. Acquisition from single channel has consumed 25% of the processor. Because one thread is continuously calling for data acquisition. Now if there are 3 similar threads that are continuously running and acquiring data from 3 channels then processor utilization will be 75%. Or you can say 3 out of 4 cores are used in running my application.
This is the complete waste of resources. This simple application is draining processor power from the system. This will not only hinder my application but other apps that are running on the system. Therefore it is necessary to keep an eye on the processor consumption. If you design your app naively then you will have to pay the price in terms of inconsistency and cost.
The solution for the problem is that instead of choosing the polling method I should use the timer based interrupts to acquire data. In this way, your processor is only consumed whenever there is an interrupt. This will free the processor for other tasks.
Interrupts can also be generated from the device if they support it or you can use DMA (Direct Memory Access) if your device supports it. For timer-based interrupts make sure that your device has enough buffer which can hold data. For the above application, the TCP/IP implementation allows us to set the buffer size. The default buffer size is 64k. Following is the code to set the buffer size for the buffer.
TcpClient client = new TcpClient(new IPEndPoint(ipAddress,portAddress));

client.Client.ReceiveBufferSize = 131072;  //128K
Finally
As a professional programmer and beat the newbies or amateurs programmers you should take into consideration the system resources your program is using specifically memory and processor. Let the newbies count the number of lines that they have written and let them write in fewer lines of code where you write code that use the optimal resources.
Paying attention to memory and processor not only help you in writing good code but also enable you to determine why some algorithms are better than others, cost analysis and determine the limits of your code.